This is the first post in my blog-based journal for my CS 4364 capstone class at Virginia Tech. It is Design of Information, and we are being asked to write journal entries throughout the class relating to homeworks, projects, and just about anything else worth writing about. I may move it somewhere else later, but this was an easy seat for now.
For our first homework, we were asked to look around us at signs. Prof. Harrison defines signs as intentionally placed pieces of information. Obviously, this is a pretty broad definition that allows for non-traditional sign selections. In this entry, I’m just going to pick a few signs and talk about why I picked them.
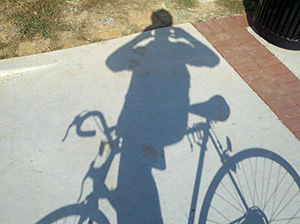
One of the signs we were asked to find was a dynamic display — one that changes what information is displayed as part of its purpose. After thinking of the obvious (plasma TV’s, electronic highway safety signs), I was looking at my shadow as the sun was setting, wondering at how long it was. I’m not sure if it completely qualifies as intentionally placed, but I would suggest that a shadow is a dynamic display. It’s appearance is a constant indicator of the time of day, weather conditions, object shape, and I”m sure many more.
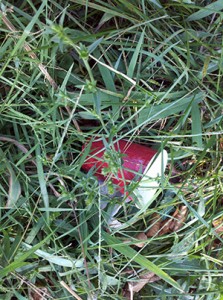
I’ll share some of the other non-dynamic signs I found while riding my bike around DT Blacksburg. We were told that a piece of trash blowing down the street did not count. Again, I’m not sure how much this next example intrudes on that, but I thought it was a very interesting sign.
A red solo cup rudely thrown in the grass on the side of the road. I’m assuming that it still rests where it was thrown, which is why I consider this information useful. I took several other pictures of Coors, Red Bull, Natty, and Yuengling (classy) cans along the same stretch. The point: I think this cup, along with the other trash, is a solid sign that drunk kids walk the stretch of road in front of the Sig-Ep house on Clay St. frequently. Intentional? Ehhh — maybe. We’ll see what Harrison thinks.
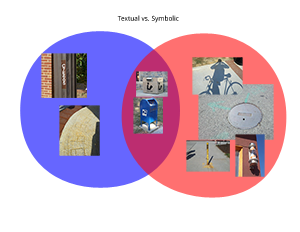
Anyway, I ended up with 16 photos from places around downtown and called it a day. The next step was to organize this information in 3 creative ways (Design of Information is big on information organization). My first thought was to break the signs into two categories: text-based and sign-based. Then I realized that some signs (such as a post box) had both. What do you do when you have 2 distinct categories with some that overlap? Venn diagram!
Simple. OK, what’s next? I was stumped for any creative ideas for a little while, focusing too much on the content of the pictures. The last 2 ideas came at once.
- Somebody might care where these photos are. I remember where I took each one as I biked. Why not map them by location so that somebody could retrace my steps and guess at my path?
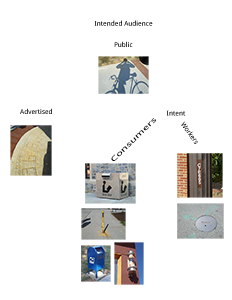
- How about who each sign targets as its audience? Certain signs are meant for a very specific audience.


