So, you’re making an Azure Cloud Service. A Cloud Service consists of either a Web Role, a Worker Role, or a combination of the two, working together to provide users with a solution that’s always on and highly scale-able. Good call!
The thing with a service is that it’s expected to be reliable. It’s also in the cloud, and there are often multiple instances of your code running at any one time, so it’s hard to attach a debugger to. Essentially, this leaves us with printf littering as our debugging mechanism for production code. Best practice is to log a ton of data, such as:
- Tracing the follow of execution
- Logging error conditions, such as exceptions, null values
- Logging variable values that will actually help you figure out what’s wrong
How do I log?
Trace.WriteLine() will work — and if you’re OK with that, then stop reading here. The Azure Cloud Services VS template hooks this up out of the box (note that Debug.WriteLine() writes to VS’s Output window by default, but won’t end up in Azure’s log tables without some configuration). But you’re likely going to want more control than just WriteLine(). Why? If you follow best practices, you’ll end up with a lot of log statements. You’ll need some control over granularity — do you just want to see errors and warnings? Just the flow of execution? Seeing everything at once will overwhelm you.
Fear not, the Trace class with help you with SourceLevels, which divides up log statements into well defined categories.
OK, that’s great, but I don’t see Trace.Write(SourceLevel, string) methods
Well, there is Trace.TraceError(), Trace.TraceWarning(), and Trace.TraceInformation(), but that’s only 3 of the 6 possible SourceLevels. And what if you want the goodness in Trace.WriteIf() in these?
Of course, .NET provides an answer in the form of TraceSource and TraceListener. You’ll need to create your own TraceSource object, passing it around and calling myTraceSource.TraceEvent(). Damn, this is getting complicated. You came here for printf littering, not passing around logging objects.
Have a (static) class
/// <summary>
/// Wapper class for writing output.
/// </summary>
public static class Trc
{
    #region Private fields

    private static TraceSource traceSource = new TraceSource("CustomTrace", SourceLevels.All);

    #endregion

    #region Public methods

    public static void Error(string message)
    {
        HelperTrace(TraceEventType.Error, message);
    }

    public static void Error(string format, params string[] values)
    {
        HelperTrace(TraceEventType.Error, format, values);
    }

    public static void ErrorIf(bool condition, string message)
    {
        HelperTraceIf(TraceEventType.Error, condition, message);
    }

    public static void ErrorIf(bool condition, string format, params string[] values)
    {
        HelperTraceIf(TraceEventType.Error, condition, format, values);
    }

    public static void Information(string message)
    {
        HelperTrace(TraceEventType.Information, message);
    }

    public static void Information(string format, params string[] values)
    {
        HelperTrace(TraceEventType.Information, format, values);
    }

    public static void InformationIf(bool condition, string message)
    {
        HelperTraceIf(TraceEventType.Information, condition, message);
    }

    public static void InformationIf(bool condition, string format, params string[] values)
    {
        HelperTraceIf(TraceEventType.Information, condition, format, values);
    }

    public static void Warning(string message)
    {
        HelperTrace(TraceEventType.Warning, message);
    }

    public static void Warning(string format, params string[] values)
    {
        HelperTrace(TraceEventType.Warning, format, values);
    }

    public static void WarningIf(bool condition, string message)
    {
        HelperTraceIf(TraceEventType.Warning, condition, message);
    }

    public static void WarningIf(bool condition, string format, params string[] values)
    {
        HelperTraceIf(TraceEventType.Warning, condition, format, values);
    }

    #endregion

    #region Private methods

    private static void HelperTrace(TraceEventType category, string format, params string[] values)
    {
        HelperTrace(category, string.Format(format, values));
    }

    private static void HelperTraceIf(TraceEventType category, bool condition, string format, params string[] values)
    {
        HelperTraceIf(category, condition, string.Format(format, values));
    }

    private static void HelperTraceIf(TraceEventType category, bool condition, string message)
    {
        if (condition)
            traceSource.TraceEvent(category, 0, message);
    }

    private static void HelperTrace(TraceEventType category, string message)
    {
        HelperTraceIf(category, true, message);
    }

    #endregion
}
Just use Trc.Error(), or a sister function throughout your code. Yes, this only has 3 of the 6 as well, but you’re free to add your own — it’s easy to extend. Why couldn’t this be a set of extension methods for Trace? Unfortunately, C# doesn’t allow for static extension methods, you can only use them on an instance of an object, which would put us right back to square one.
That’s not all though you’ve gotta do though. I wish it was, but the next bit seems unavoidable. You’ll notice that the Trc class writes to a TraceSource, given the name “CustomTrace”. If you stop here, nobody will be listening to the “CustomTrace” source, and you’ll see no output. To setup listeners, you’ll need to head to your config file. In a Worker Role, this is your app.config file:
<?xml version="1.0" encoding="utf-8"?>
<configuration>
  <system.diagnostics>
    <sharedListeners>
      <add
        type="Microsoft.WindowsAzure.Diagnostics.DiagnosticMonitorTraceListener, Microsoft.WindowsAzure.Diagnostics, Version=2.1.0.0, Culture=neutral, PublicKeyToken=31bf3856ad364e35"
        name="AzureDiagnostics">
        <filter type="" />
      </add>
    </sharedListeners>
    <sources>
      <source name="CustomTrace">
        <listeners>
          <add name="AzureDiagnostics"/>
        </listeners>
      </source>
    </sources>
    <trace>
      <listeners>
        <add name="AzureDiagnostics"/>
      </listeners>
    </trace>
  </system.diagnostics>
</configuration>
The drain you want to pour all messages down is the sharedListener named AzureDiagnostics. You can see that “CustomTrace” and <trace> (meaning the default Trace.WriteLine(), Trace.TraceError(), etc calls) both have the AzureDiagnostics listener. This will ensure that all of your logs end up in all the right places.
Where do my logs go?
Well, when you’re debugging locally using the Azure emulator, they show up in Visual Studio’s Output window. That’s great for local debugging, but when your service is live you’ll need a more permanent storage solution. You might not find out about an issue until days after it occurred, so you need the logs stored for you.
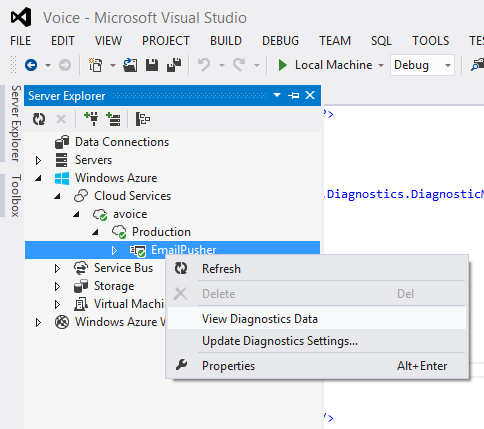
Azure does this for you automatically in the form of the WADLogsTable (WindowsAzureDiagnosticsLogsTable). The AzureDiagnostics TraceListener conveniently writes both to the Output window and to the WADLogsTable. There are a number of ways to view the table, but the easiest is using the Server Explorer in Visual Studio:

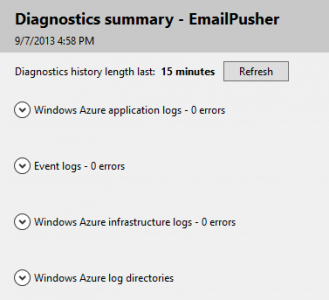
View Diagnostics Data takes you to a summary page.

Windows Azure application logs is where your Web or Worker role logs to. Click the drop-down arrow next to it to see details, and hit the View all data link to get to the actual WADLogsTable, which will show all the logs. You can delete stale logs here if needed.
Restricting the flow of information
You went through the trouble of deciding whether to log an error, warning, or informational message, so you’d probably like to be able to filter on those levels. You could log all messages and then filter the WADLogsTable based on your desired level, but you might run out of space rather quickly.
One solution is described by Mike Kelly in Take Control of Logging and Tracing in Windows Azure. I started with that solution, but it was too complex for what I was creating and it actually duplicates some functionality built-in to Azure. However, if you wanted multiple TraceSources (say one for logging setup task information, another for core logic) and wanted to regulate the log level of each independently, Mike’s solution is the way to go.
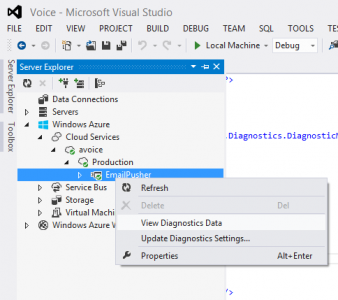
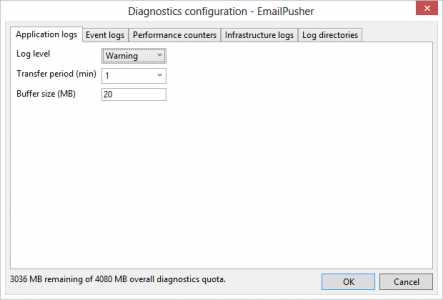
That said, here’s how I switch log levels on the fly, without having to bring my service down to do it. Look at the Update Diagnostics Settings… option in the same dialog as before:


Under the “Application logs” tab, you can easily change your log level. In this case “Warning” means log Warning, Error, and Critical to the WADLogsTable.
What this does behind the scenes is updates your diagnostics.wadcfg file. The other tabs do lots of other great things, but that’s beyond the scope of printf littering.